Finding productive offshore fishing spots isn’t luck—it requires understanding underwater terrain, reading ocean conditions, and using the right technology. Whether you’re targeting red snapper in the Gulf of Mexico or yellowfin tuna near the Gulf Stream, success starts long before you cast a line. The key lies in locating structure where fish congregate, leveraging digital tools to pinpoint productive zones, and observing real-time environmental cues that reveal where fish are actively feeding.
This guide reveals a step-by-step system for consistently locating offshore fishing spots. You’ll learn how to identify the continental shelf edge, interpret satellite oceanographic data, spot feeding frenzies from miles away, and import proven GPS waypoints into your chartplotter. Whether you’re a weekend warrior or planning a deep-sea expedition, these methods work anywhere from the Atlantic to the Gulf of Mexico.
Why the Continental Shelf Edge Is Your Best Starting Point
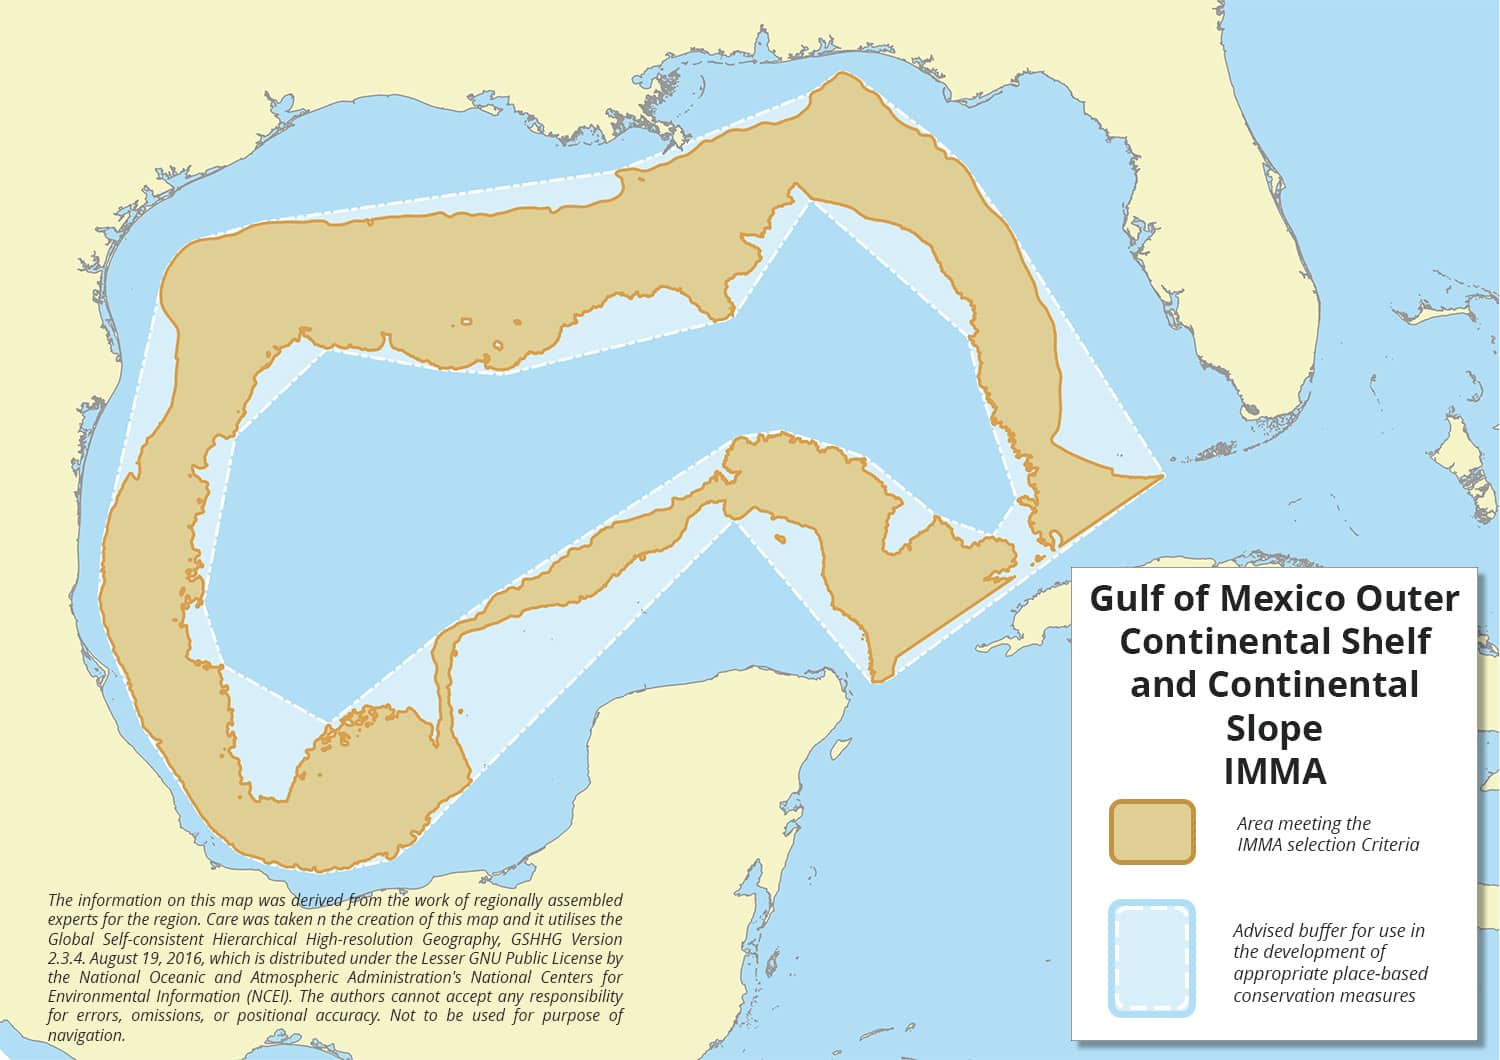
The continental shelf edge, also called the drop-off or 100-fathom curve, marks the transition from shallow continental shelf waters to the deep ocean. This sharp depth change creates powerful current interactions, nutrient upwelling, and abundant prey, making it one of the most reliable fish-attracting features globally. In the Gulf of Mexico along the Florida Panhandle, the edge begins around 110 feet, steepens to 180 to 200 feet, and levels near 300 feet in areas like Dotto Canyon.
Locating the 100-Fathom Curve
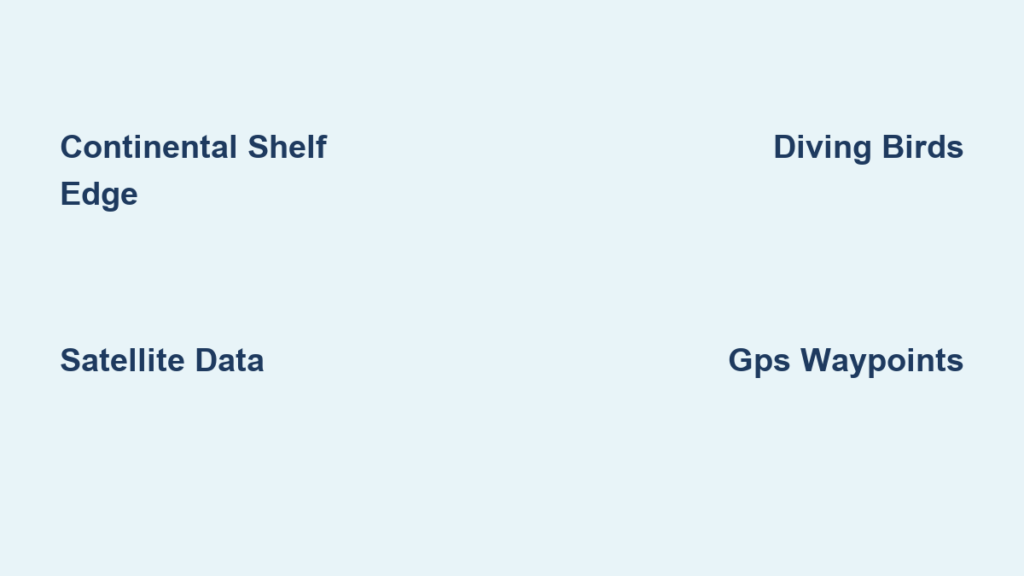
Use Google Earth to visually identify the edge by looking for a sharp change in water color from turquoise to deep blue. Zoom in to see texture shifts indicating depth gradients, then drop a waypoint directly on the steepest part of the slope. Export these coordinates to your GPS or chartplotter before departure. Even without sonar, hitting the edge puts you in the strike zone.
Targeting High-Percentage Structures Along the Edge
Not all parts of the edge are equally productive. Focus on specific formations where fish stack up.
Specific structures to target include:
- Nipples: Underwater pinnacles that break current and shelter bait
- Elbows: Bends in the edge where currents swirl, creating eddies
- Spurs: Narrow extensions acting as natural funnels for pelagics
- Canyons: Deep incisions like Dotto Canyon offering vertical habitat
These structures create current breaks and ambush points, making them magnets for gag grouper, scamp, and amberjack.
How to Locate Reefs, Wrecks, and Oil Rigs
Artificial and natural structures act as underwater oases in otherwise barren seas. Knowing where they are and how to fish them is critical for consistent success.
Using Free Strike Lines Data
Strike Lines offers free downloadable files showing government-mapped reefs, edges, and deep formations. This resource is compatible with Google Earth, chart plotters, and Navionics. It reveals hundreds of offshore structures, eliminating blind searching. While public access increases fishing pressure on these spots, they remain proven starting points for any offshore trip.
Purchasing Guide-Sourced GPS Waypoints
For private, high-yield locations, purchase from Florida GPS Fishing Spots at floridafishingspots.com. This provider offers over 200 to 300 spots per area, including deep-drop zones, wrecks, ledges, and oil rigs. Data is sourced from local guides since the 1990s.
When you purchase, you receive:
- Labeled PDF list with habitat notes
- KML file for Google Earth
- Navionics Boating app import
- SD card or pre-loaded card option
Look for the blue oval logo to verify you’re getting the original provider, trusted by professional anglers.
Fishing Around Oil Platforms and Buoys
Offshore oil platforms in the Gulf of Mexico function as massive artificial reefs from seabed to surface. They host grouper, snapper, and amberjack near the base while attracting wahoo, tuna, and king mackerel in surrounding waters. These platforms are ideal for trolling, jigging, and sight casting.
Buoys often mark submerged structures or navigation hazards. They provide shade for baitfish, drawing cobia, jack crevalle, and kingfish. Scan around every buoy even if it looks inactive. Predators patrol these zones daily.
Using Satellite Data to Find Fish-Holding Zones

Top anglers analyze real-time oceanography to turn average spots into feeding factories. The right conditions dramatically increase your chances.
Leveraging Hilton’s Interactive Maps
At approximately $200 per year, Hilton’s integrates multiple data layers into one interactive map.
Key data layers include:
- 3D Bottom Contour: See ledges, spurs, and pinnacles critical for rig selection
- Chlorophyll Concentration: Green or yellow indicates phytoplankton blooms leading to baitfish and predators
- Salinity Gradients: Fresh-salt interfaces create strong currents and mixing zones
- Altimetry Data: Detect upwelling versus downwelling. Upwelling zones bring nutrients to the surface and trigger feeding frenzies
Free NOAA and NASA data exist, but Hilton’s saves hours by combining everything in one place.
Monitoring NOAA Tides and Currents
Visit tidesandcurrents.noaa.gov for real-time current speed and direction, water temperature, and tidal height. Use this data to time trips during peak current flow, identify temperature breaks where warm and cold water meet, and avoid slack tides when fish are less active.
Matching Species to Depth and Structure
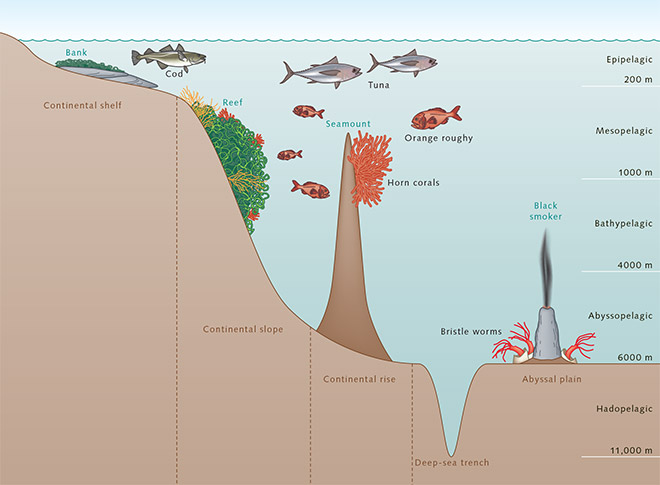
Fish sort themselves by depth and structure. Matching your target species to the right zone dramatically improves your catch rate.
Shallow Zone Patterns
In waters under 100 feet, you’ll find red snapper, vermilion snapper (also called mingo), and triggerfish. These species prefer live bottom and hard substrate where light penetration supports sponge and coral growth.
Along the Edge
At 100 to 180 feet depth, target gag grouper, scamp, and amberjack. These species prefer ledges, spurs, and hard bottom. Use deep-drop rigs or vertical jigs for best results.
Beyond the Edge
In deep waters from 180 to 300-plus feet, deep-water groupers, tilefish, and swordfish dominate. Target canyons, deep wrecks, and areas with significant vertical relief. Nighttime deep dropping is particularly effective for swordfish.
Open Water Above Structure
Mahi-mahi, wahoo, sailfish, and tuna patrol current lines, floating debris, and buoys. Follow warm water and convergence zones. Pelagics use the edge as a migration highway, especially during spring and fall runs.
Reading Surface Signs While On the Water
Even with perfect data, real-time observation seals the deal. Your eyes are one of the most valuable tools on the water.
Spotting Diving Birds
Birds are your eyes from miles away. Terns and gannets diving indicate baitfish pushed to the surface by predatory fish below. Circling flocks suggest ongoing predator attack. These signs often appear before surface boils or splashes. Head toward bird activity at full speed and use sonar to confirm bait balls and gamefish below.
Looking for Surface Disturbances
Scan the horizon with polarized sunglasses to spot boils (explosive water eruptions from fish attacking bait), tail wakes (fast-moving lines indicating tuna or kingfish on the hunt), and bait balls (schools of small fish breaking surface). These signs often last only minutes, so react quickly when you spot them.
Following Currents and Temperature Breaks
Currents drive the entire offshore food chain. Master them, and you master fish location.
Tracking the Gulf Stream
The Gulf Stream is a warm, fast-moving current flowing from the Gulf of Mexico up the Atlantic coast. Located in deep valleys offshore, it serves as a year-round migration route for tuna, marlin, sailfish, and swordfish. Look for color changes (turquoise to deep blue), temperature breaks (5°F or more difference over short distance), and slick lines where currents converge. Fish the nearest structure when favorable current pushes warm water inshore.
Finding Upwelling Zones
When deep, cold, nutrient-rich water rises to the surface, it triggers phytoplankton blooms, attracts baitfish, and draws in predators. Identify upwelling zones through satellite altimetry showing positive sea surface height anomalies, chlorophyll maps showing green or yellow patches, and onboard thermometer detecting sudden cool spots. These zones can produce nonstop action for hours.
Building Your Personal GPS Spot Database
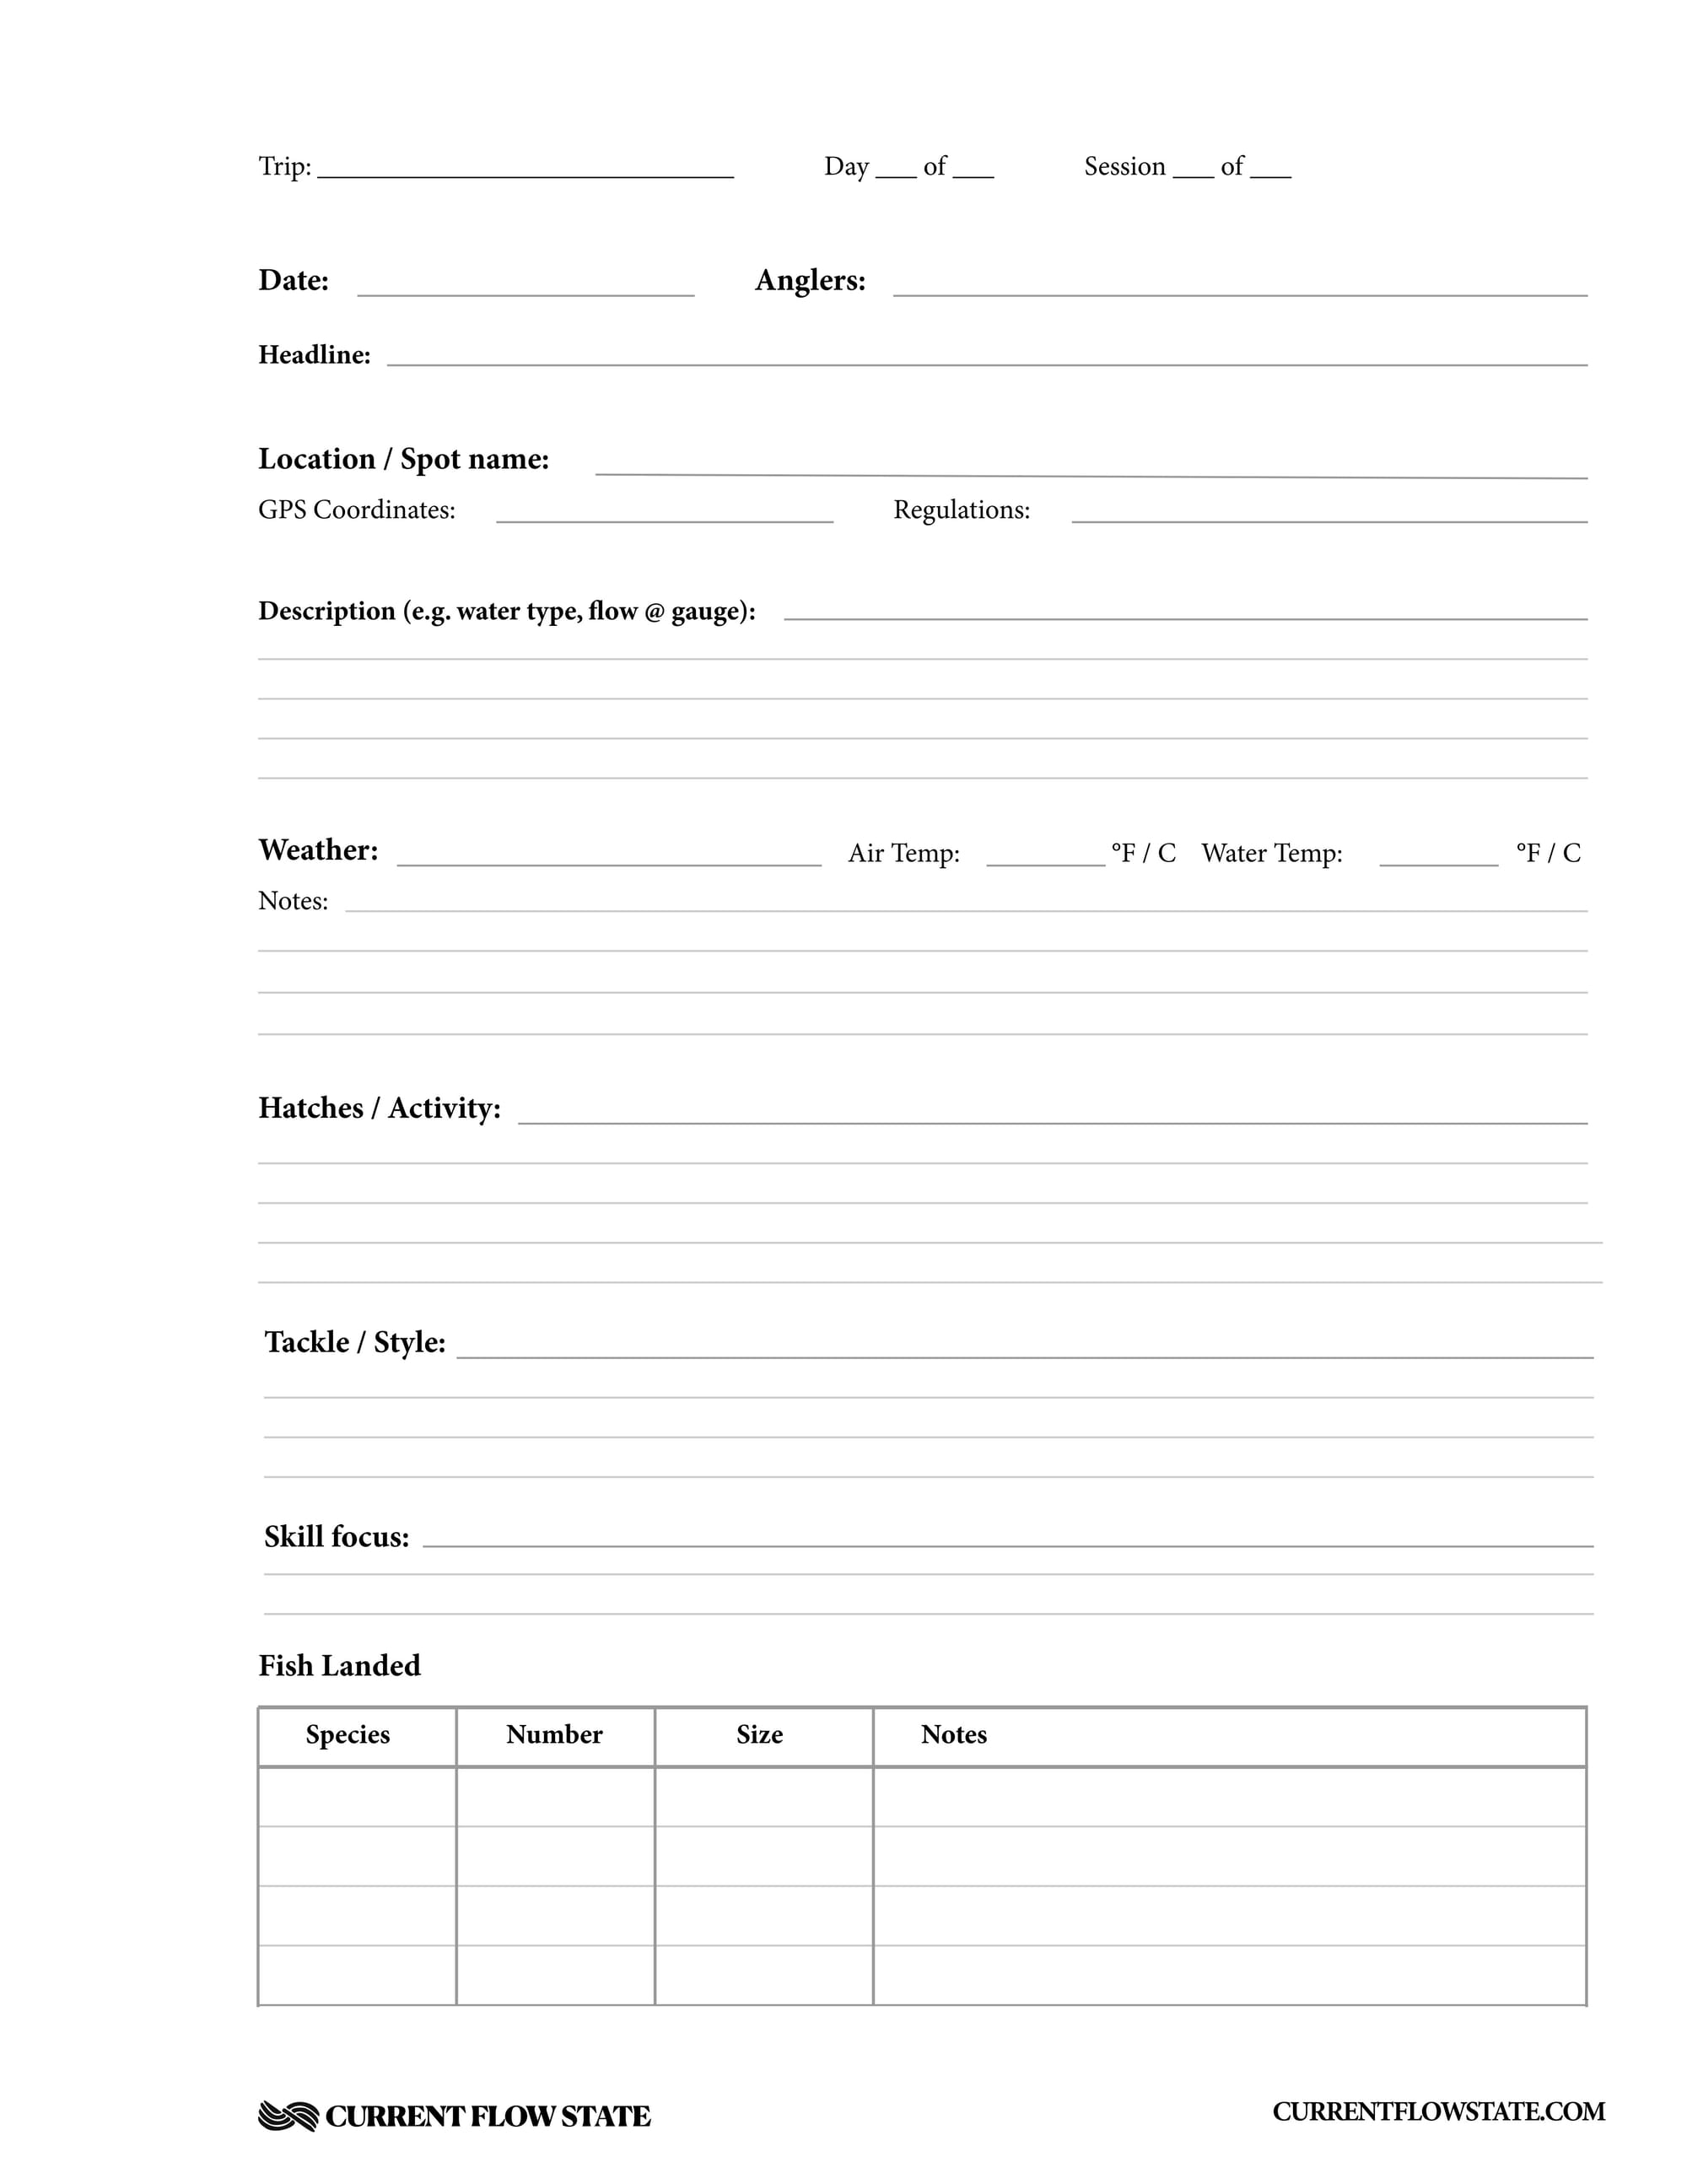
The best anglers don’t rely solely on others. They build their own intelligence over time through systematic logging.
Recommended Workflow
Follow this proven process to build your personal spot database:
- Plan on Google Earth: Mark the edge, canyons, and spurs
- Cross-check with Strike Lines: Add public reef clusters
- Import guide-sourced waypoints: Load private spots into Navionics or GPS
- Analyze oceanographic data: Adjust for chlorophyll, current, and upwelling
- Navigate to structure: Confirm with sonar looking for hard bottom and vertical relief
- Observe on water: Watch birds, boils, and floating objects
- Adapt and move: Follow temperature breaks or current lines
- Record every catch: Save spot with notes on species, depth, rig, bait, time, and conditions
Over time, your log becomes a custom fishing atlas that no one else has.
Optimizing Your Electronics for Offshore Success
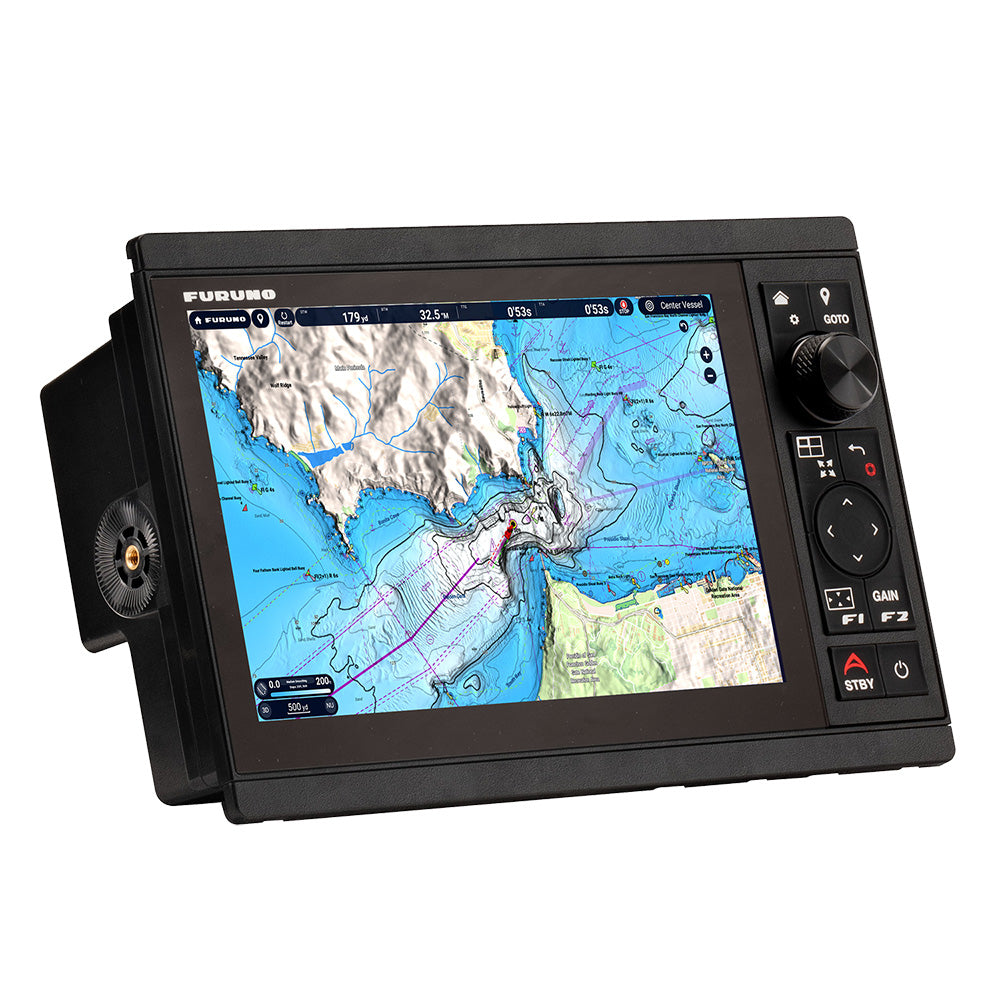
Your boat’s electronics are only as good as the data you feed them. Ensure seamless integration by using the right file formats.
Compatible File Formats by Brand
Different chartplotter brands support different formats. Garmin supports GPX and CSV files using BaseCamp software. Lowrance and Simrad use SL2 and NSX formats with Insight Genesis and C-MAP. Humminbird works with HWR and BIN files through LakeMaster and UniFlash. Raymarine is compatible with RNC and Navionics using LightHouse OS. Furuno TZ accepts TZT format and hybrid charts.
Mobile App Integration
Pre-download regions so you’re not relying on spotty offshore signal. The Navionics Boating App lets you import KML and GPX files while overlaying tides, weather, and sonar. Active Captain (Garmin) provides community-based spot sharing and real-time hazard updates. The Google Earth App allows you to view and navigate to saved waypoints offline.
Key Takeaways for Finding Offshore Fishing Spots
Finding offshore fishing spots is no longer a game of chance. With the right approach, any angler can consistently locate productive zones. Start by mastering the continental shelf edge, then layer in reefs, wrecks, and oil rigs using tools like Strike Lines and guide-sourced GPS databases. Enhance your edge with satellite oceanography from Hilton’s or NOAA, and confirm activity with bird sightings and surface boils.
Your boat’s electronics are only as good as the data you feed them. Import proven waypoints, integrate real-time conditions, and log every successful spot. Over time, you’ll develop a personal network of high-percentage zones, turning guesswork into repeatable success.
Remember: structure is constant, but fish are mobile. Find the structure, monitor the current, follow the birds, and let the ocean reveal its secrets.
Frequently Asked Questions About Finding Offshore Fishing Spots
What is the best free tool for locating offshore structures?
Google Earth combined with Strike Lines data offers the best free option for identifying the continental shelf edge, reef clusters, and offshore formations. Google Earth shows visual depth transitions, while Strike Lines provides government-mapped reef coordinates compatible with most chart plotters.
How do I find offshore fishing spots without sonar?
Start with pre-planned waypoints using Google Earth and Strike Lines data. Identify the continental shelf edge visually through water color changes, then navigate to marked coordinates. Once on location, watch for surface signs like diving birds, boils, and floating debris that indicate active fish.
What depth is best for red snapper?
Red snapper typically inhabit waters from 60 to 180 feet deep, preferring reefs, wrecks, and hard bottom areas. Summer months during the spawning season offer the most consistent action, as these fish aggregate in large schools around structure.
What does it mean when birds are diving offshore?
Diving birds indicate baitfish being pushed to the surface by predatory gamefish below. Terns and gannets diving signal an active feeding frenzy. Head toward bird activity immediately and use sonar to confirm the bait ball and predators below.
Are purchased GPS fishing databases worth the cost?
Purchased databases from reputable sources like Florida GPS Fishing Spots provide private, guide-sourced waypoints not available on public maps. With 200 to 300 spots per area including deep-drop zones, wrecks, and oil rigs, these databases eliminate hours of searching and provide proven starting points. Verify authenticity by looking for established provider logos.